Warpwire allows administrators of Media Libraries and owners of media assets to view data about which users have watched or listened to a particular asset, and to track engagement visually. This feature is available for video and audio assets.
This information makes it easy for instructors and administrators to track engagement on a user-by-user basis. You can see which users are viewing the content you’ve uploaded, and whether they’re watching all the way through, or if they stop viewing partway through. You can also choose the date range for the report, which makes it easy to see who’s viewed an asset within a certain time period (e.g. during the open period for an assignment).
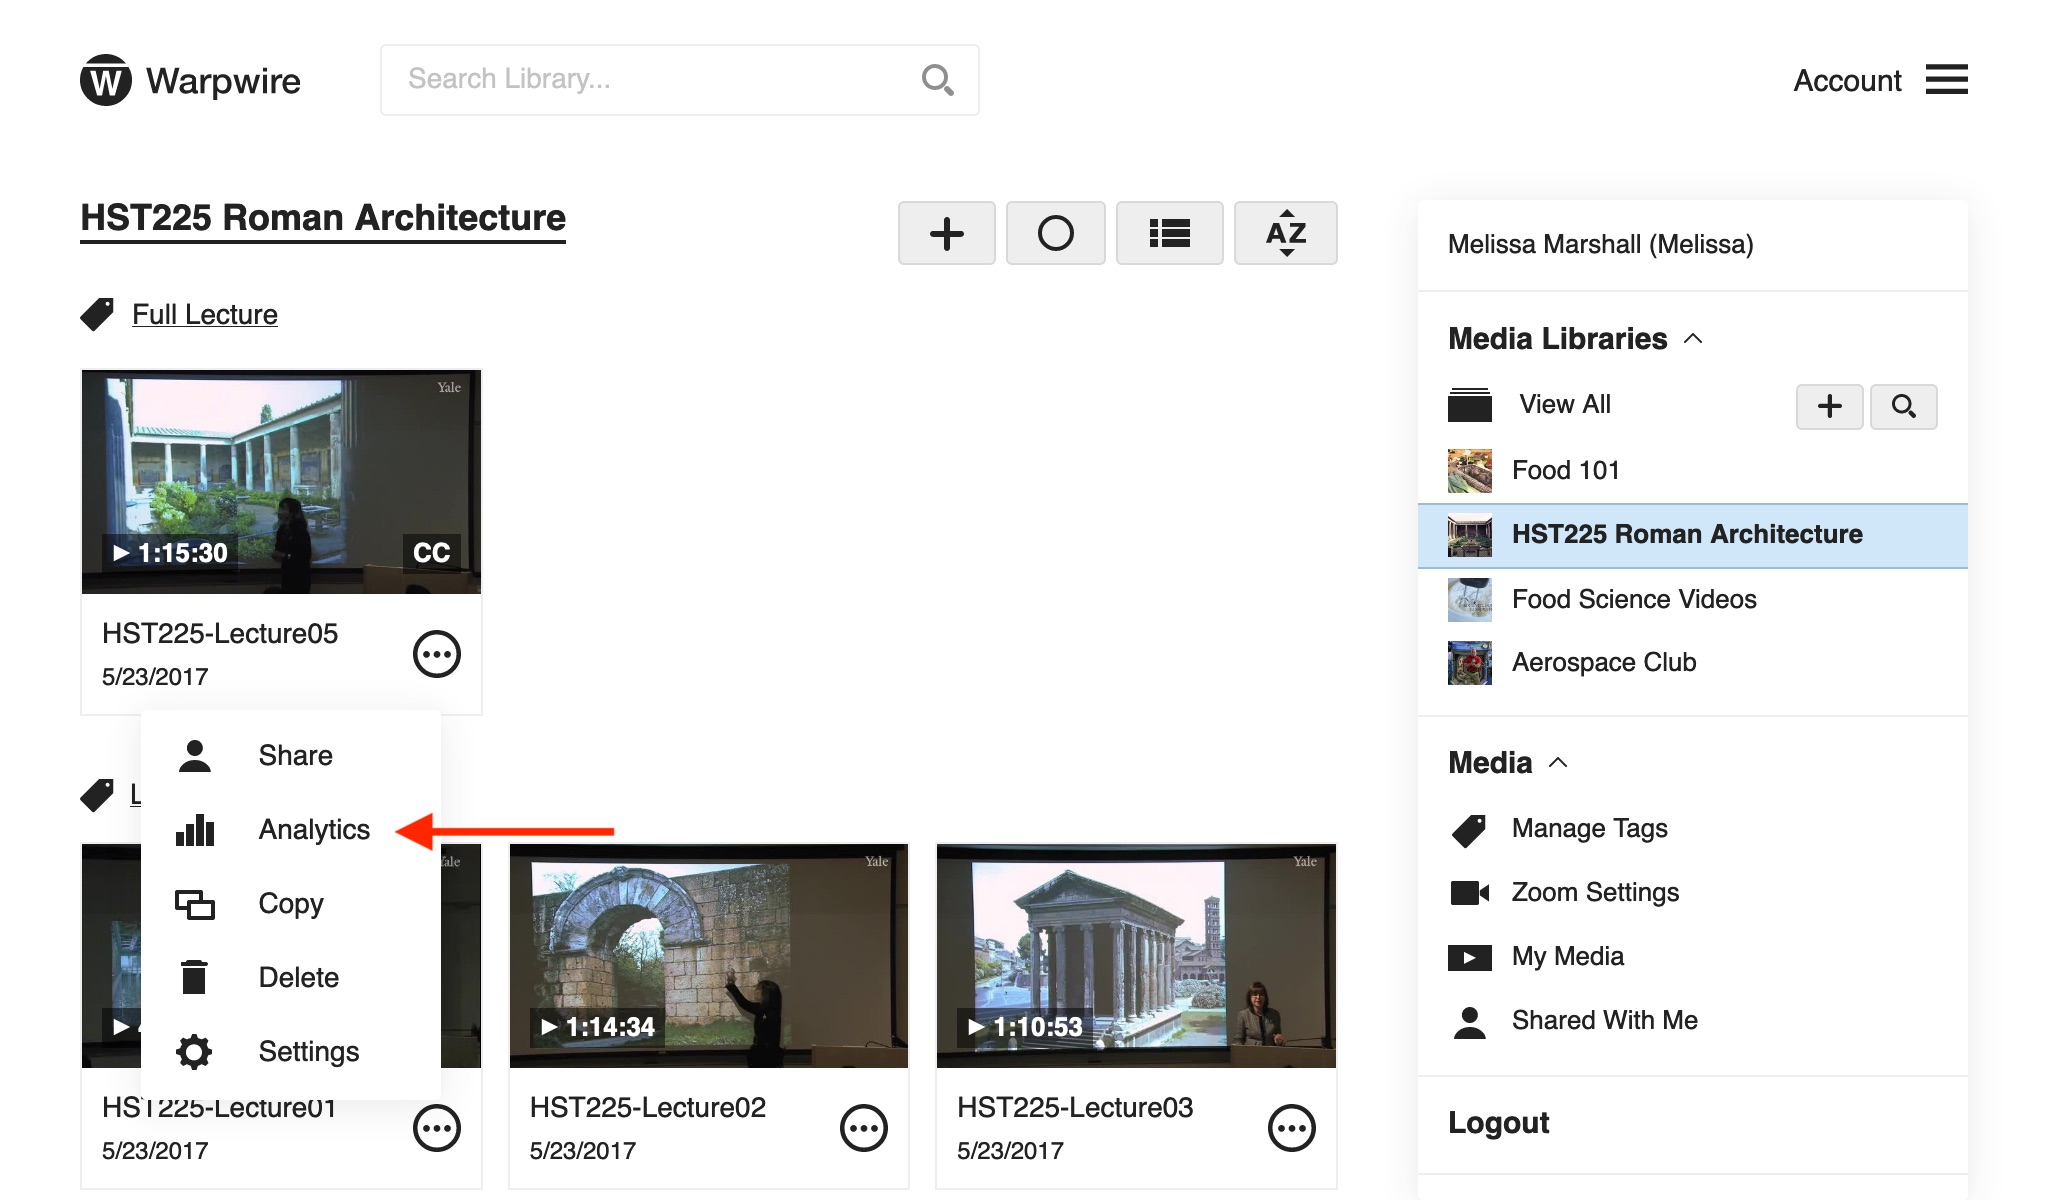
To see this information, click the Media options icon ![]() on any video or audio asset, then click "Analytics."
on any video or audio asset, then click "Analytics."
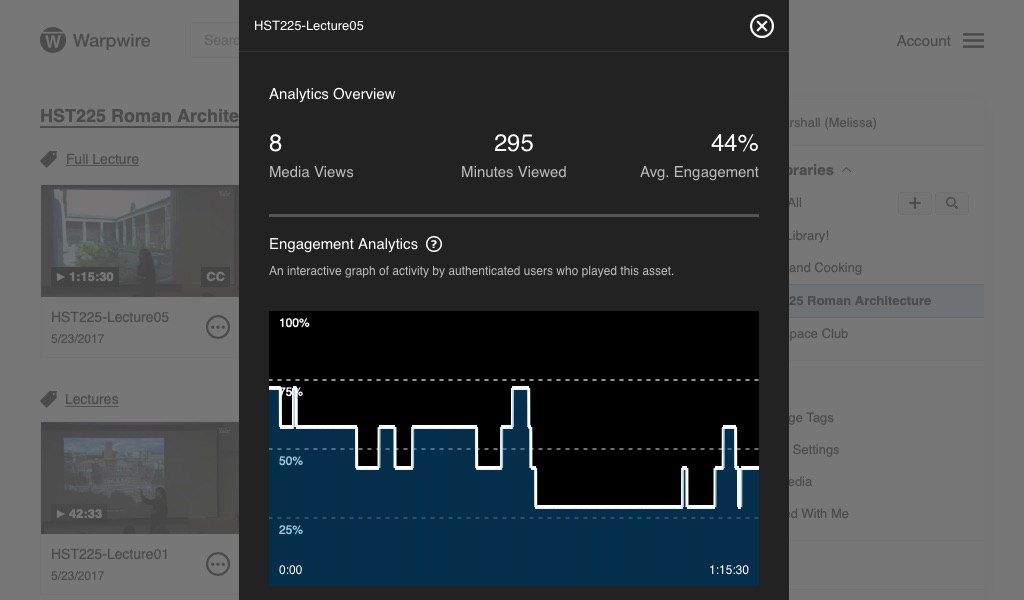
At the top of the Analytics window you'll see an engagement graph for the asset. This shows, out of all the users who have pressed play, what percent of viewers were watching/listening at any given time. This allows you to see the most and least popular parts of your video or audio for the entire audience.
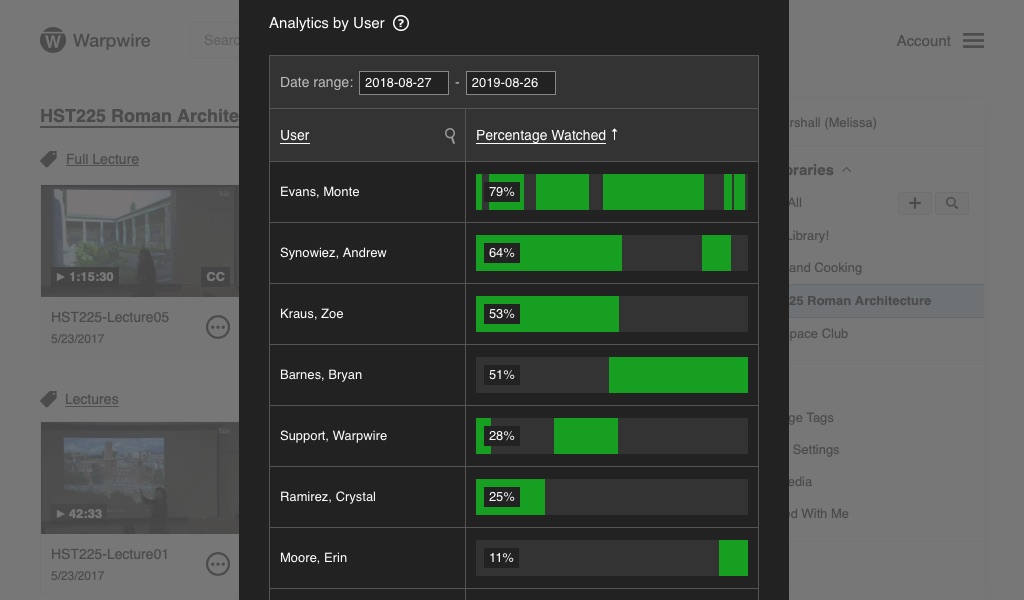
Below the engagement graph is an automatically aggregated list of all users who have access to the asset. For each user, you’ll see associated information about the percent of the asset they’ve viewed/listened, as well as a detailed bar showing which segments of the asset they’ve viewed/listened.
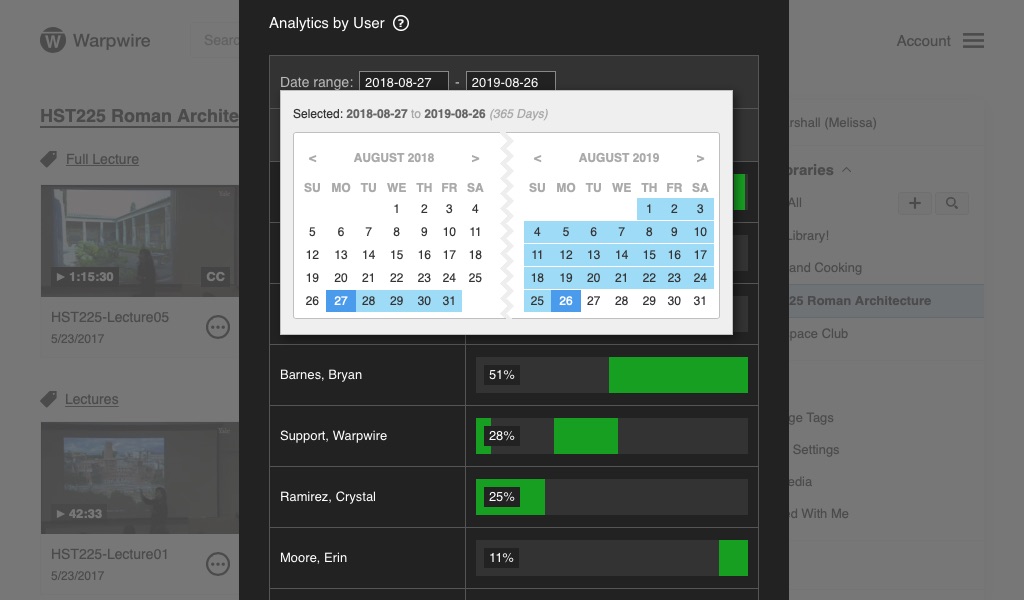
The information is displayed for a given date range, which you can customize. Simply select the start and end dates, and the data will update accordingly.
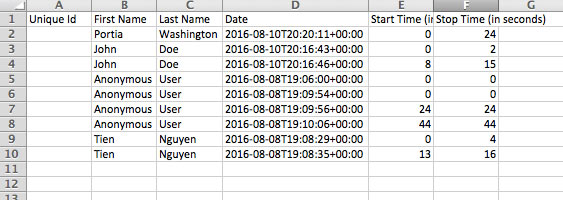
You can sort the list by user, or by percentage. This information can also be downloaded as a CSV file, for use in Microsoft Excel or other third-party analytic software. The CSV download includes even more detailed information, with to-the-second timestamps of which segments of the asset each user watched, and timestamps for when they watched.
See also: for Media Libraries, for Institutional Admins and Warpwire Hotspot Analytics API.